Gitaly is a Git RPC service that we are currently rolling out
across GitLab.com, to replace our legacy NFS-based file-sharing solution. We expect it to be faster, more stable
and the basis for amazing new features in the future.
We're still in the process of porting Git operations to Gitaly, but the service has been
running in production on GitLab.com for about nine months, and currently peaks at about 1,000
gRPC requests per second. We expect the migration effort to be completed
by the beginning of April at which point all Git operations in the GitLab application will
use the service and we'll be able to decommission NFS infrastructure.
Worrying performance improvements
The first time we realized that something might be wrong was shortly after we'd finished deploying a new release.
We were monitoring the performance of one of the gRPC endpoints for the Gitaly service and noticed that the
99th percentile performance of the endpoint had dropped from 400ms down to 100ms.
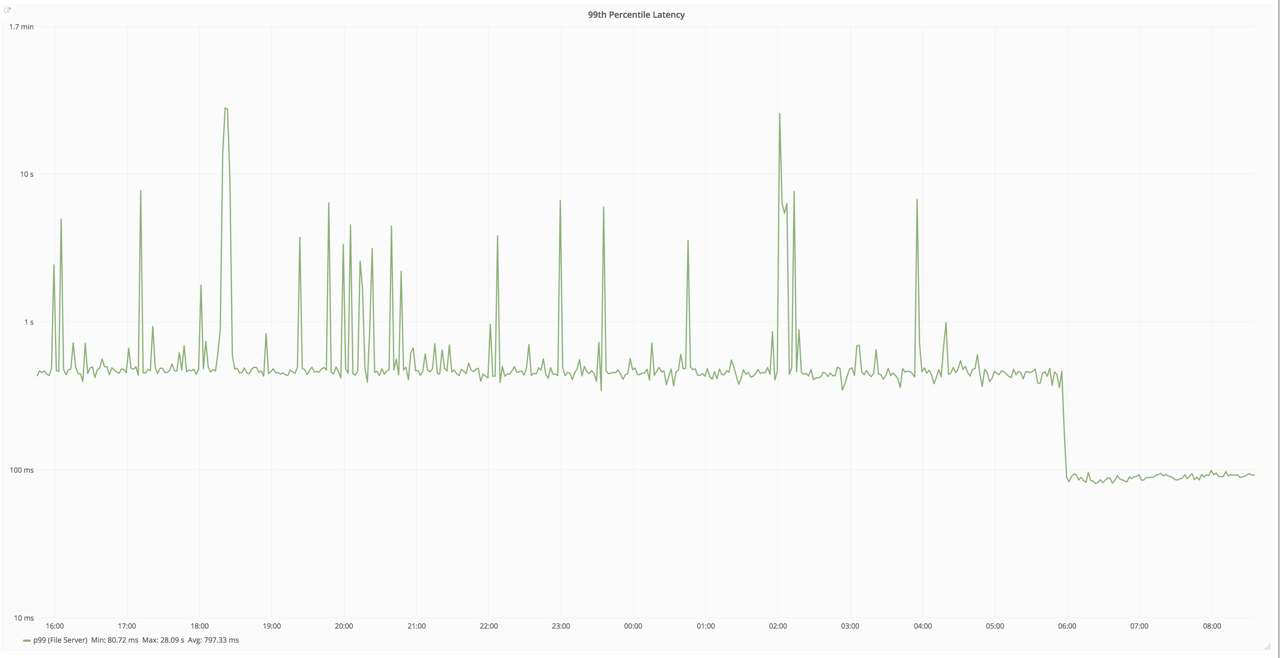
Latencies drop from 400ms to 100ms after a deploy, for no good reason
This should have been fantastic news, but it wasn't. There were no changes that should have led to faster
response times. We hadn't optimized anything in that release; we hadn't changed the runtime and the new
release was using the same version of Git.
Everything should have been exactly the same.
We started digging into the data a little more and quickly realised that 400ms is a very high latency for
an operation that simply confirms the existence of a Git reference.
How long had it been this way? Well it started about 24 hours after the previous deployment.
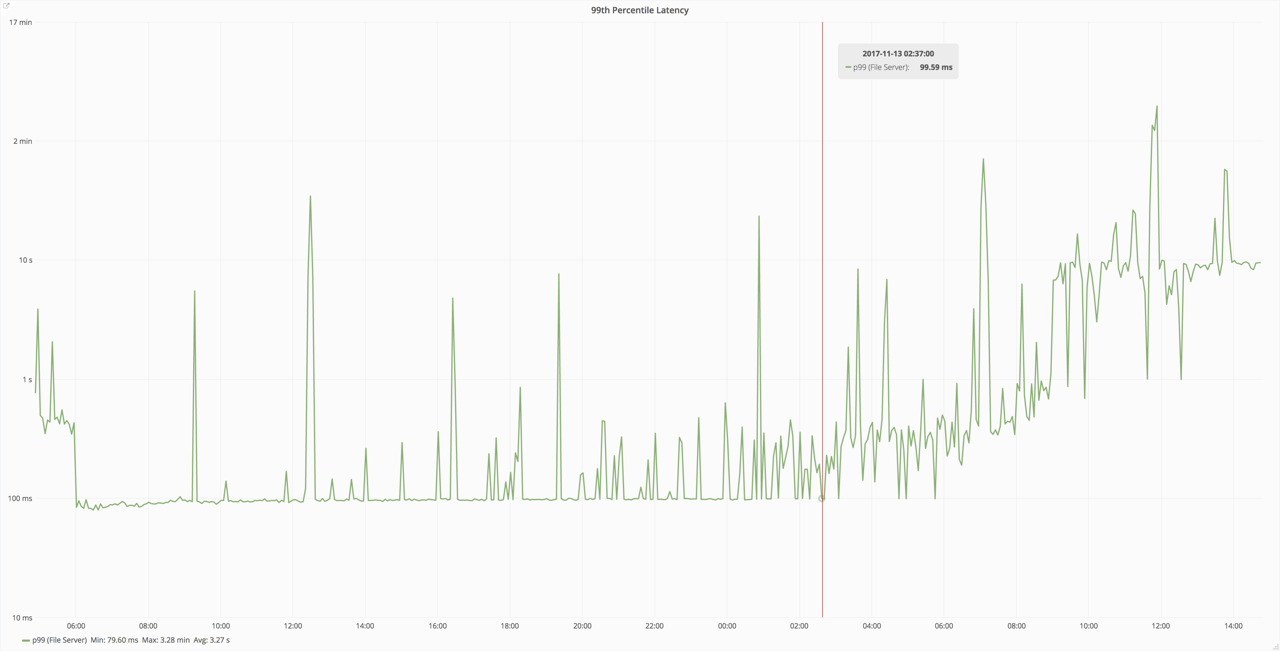
Latencies rising over a 24 hour period following a deployment, for no good reason
When browsing our Prometheus performance data, it quickly became apparent that this pattern was being repeated with each
deployment: things would start fast and gradually slow down. This was occurring across all endpoints. It had been this way for a while.
The first assumption was that there was some sort of resource leak in the application, causing the host to slow
down over time. Unfortunately the data didn't back this up. CPU usage of the Gitaly service did increase, but the
hosts still had lots of capacity.
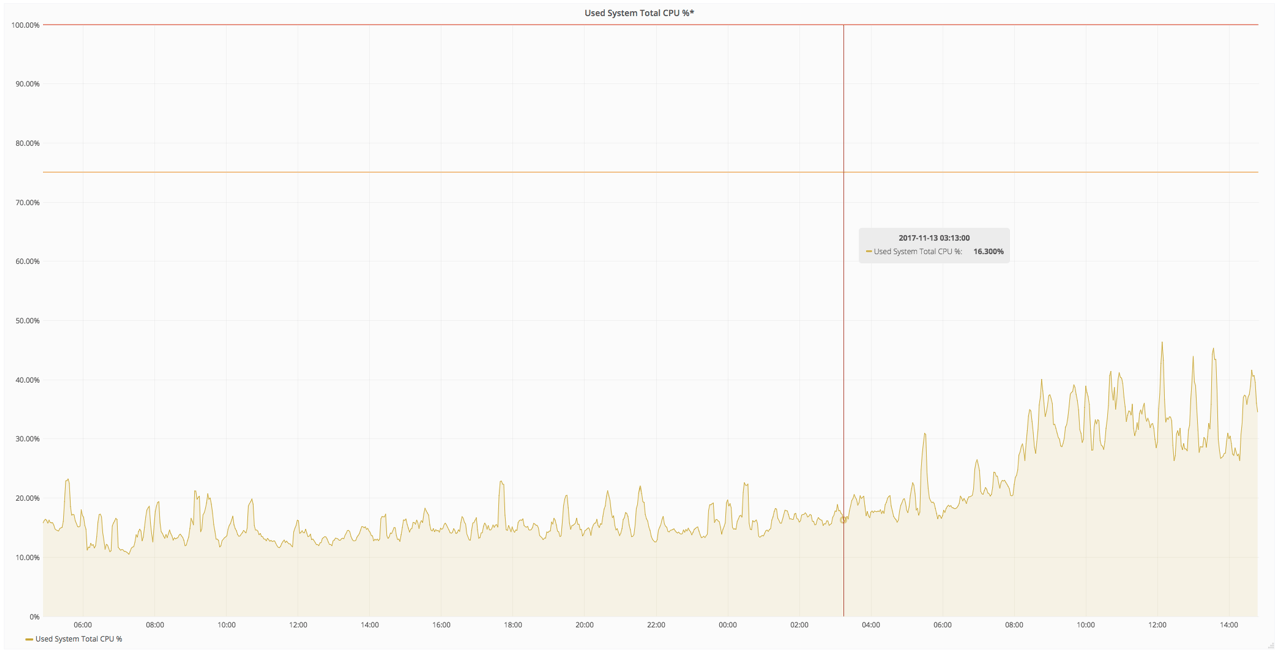
Gitaly CPU increasing with process age, but not enough to explain the problem
At this point, we still didn't have any good leads as to the cause of the problem, so we decided to further
improve the observability of the application by adding pprof profiling support
and cAdvisor metrics.
Profiling
Adding pprof support to a Go process is very easy.
The process already has a Prometheus listener and we added a pprof handler on the same listener.
Since production teams would need to be able to perform the profiling without our assistance, we
also added a runbook.
Go's pprof support is easy to use and in our testing, we found that the overhead it
added to production workloads was negligible, meaning we could use it in production without concern
about the impact it would have on site performance.
cAdvisor
The Gitaly service spawns Git child processes for many of its endpoints. Unfortunately these Git
child processes don't have the same instrumentation as the parent process so it was
difficult to tell if they were contributing to the problem. (Note: we record getrlimit(2) metrics for Git processes but cannot observe grandchild processes spawned by Git, which often do much of the heavy lifting)
On GitLab.com, Gitaly is managed through systemd, which will automatically create a cgroup for
each service it manages.
This means that Gitaly and its child processes are contained within a single cgroup, which we
could monitor with cAdvisor, a Google monitoring tool
which supports cgroups and is compatible with Prometheus.
Although we didn't have direct metrics to determine the behavior of the Git processes, we could
infer it using the cgroup metrics and the Gitaly process metrics: the difference between the
two would tell us the resources (CPU, memory, etc) being consumed by the Git child processes.
At our request, the production team added cAdvisor to the Gitaly servers.
Having cAdvisor gives us the ability to know what the Gitaly service, including all its child
processes, is doing.
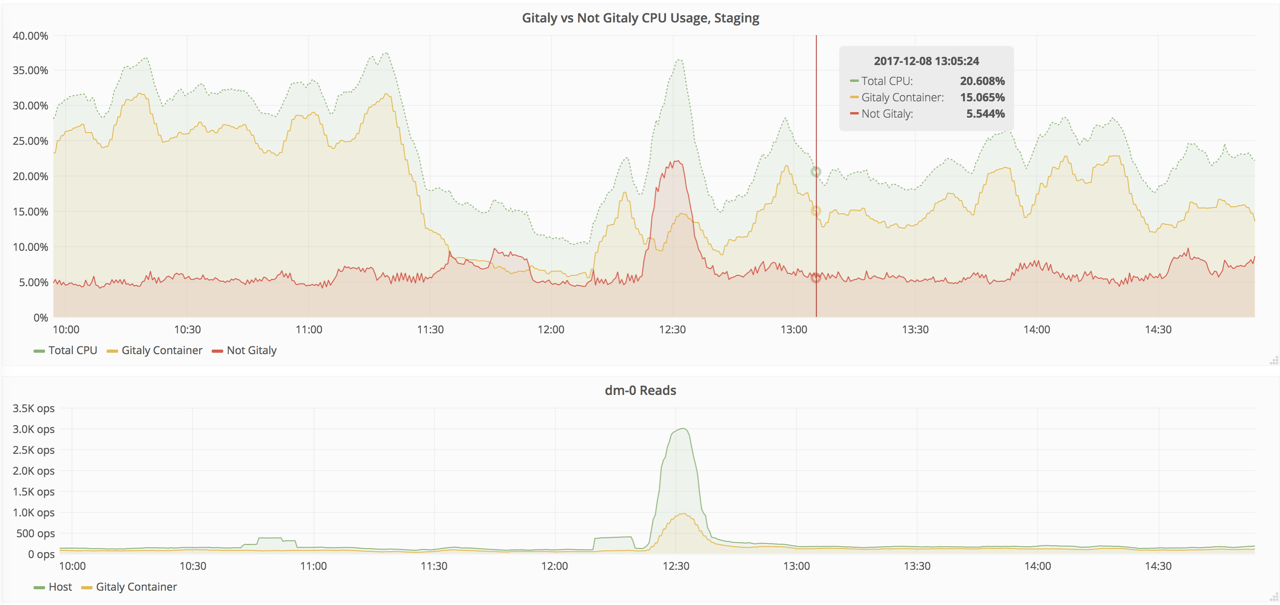
cAdvisor graphs of the Gitaly cgroup
From bad to worse. Much, much worse...
In the meantime, the situation had got far worse.
Instead of only seeing gradual latency increases over time, we were now seeing far more serious lockups.
Individual Gitaly server instances would grind to a halt, to the point where all new incoming TCP connections
were not being accepted. This proved to be a problem to using pprof: during the lockup the connection
would time out when attempting to profile the process. Since the reason we added pprof was to observe the
process under duress, that approach was a bust.
Interestingly, during a lock-up, CPU would actually decrease – the system was not overloaded, but actually
idled. Iops, iowait and CPU would all drop way down.
Eventually, after a few minutes the service would recover and there would be a surge in backlogged
requests. Usually though, as soon as the state was detected, the production team would restart the
service manually.
The team spent a significant amount of time trying to recreate the problem locally, with little success.
Forking locks
Without pprof, we fell back to SIGABRT thread dumps
of hung processes. Using these, we determined that the process had a large amount of contention around syscall.ForkLock
during the lockups. In one dump, 1,400 goroutines were blocked waiting on ForkLock – most for several minutes.
syscall.ForkLock has the following documentation:
Lock synchronizing creation of new file descriptors with fork.
Each Gitaly server instance was fork/exec'ing Git processes about 20 times per second so we seemed to finally have a very promising lead.
Serendipity
Researching ForkLock led us to an issue on the Go repository,
opened in 2013, about switching from fork/exec to clone(2) with CLONE_VFORK and CLONE_VM
on systems that support it: golang/go#5838
The clone(2) syscall with CLONE_VFORK and CLONE_VM is the same as
the posix_spawn(3) c function, but the latter is easier to
refer to, so let's use that.
When using fork, the child process will start with a copy of the parent processes' memory.
Unfortunately this process takes longer the larger the virtual memory footprint the process has.
Even with copy-on-write, it can take several hundred milliseconds in a memory-intensive process.
posix_spawn doesn't copy the parent processes' memory space and has a roughly constant time.
Some good benchmarks of fork/exec vs. posix_spawn can be found here: https://github.com/rtomayko/posix-spawn#benchmarks
This seemed like a possible explanation. Over time, the virtual memory size (VMM) of the Gitaly process would increase. As VMM
increased, each fork(2) syscall would take longer. As fork latency increased, syscall.ForkLock contention would increase.
If fork time exceeded the frequency of fork requests, the system could temporarily lock up entirely.
(Interestingly, TCPListener.Accept
also interacts with syscall.ForkLock,
although only on older versions of Linux. Could this be the cause of our failure to connect to the pprof listener during a lockup?)
By some incredibly good luck, golang/go#5838, the switch from fork to posix_spawn, had,
after several years' delay, recently landed in Go 1.9, just in time for us. Gitaly had been compiled with Go 1.8.
We quickly built and tested a new binary with Go 1.9 and manually deployed this
on one of our production servers.
Spectacular results
Here's the CPU usage of Gitaly processes across the fleet:
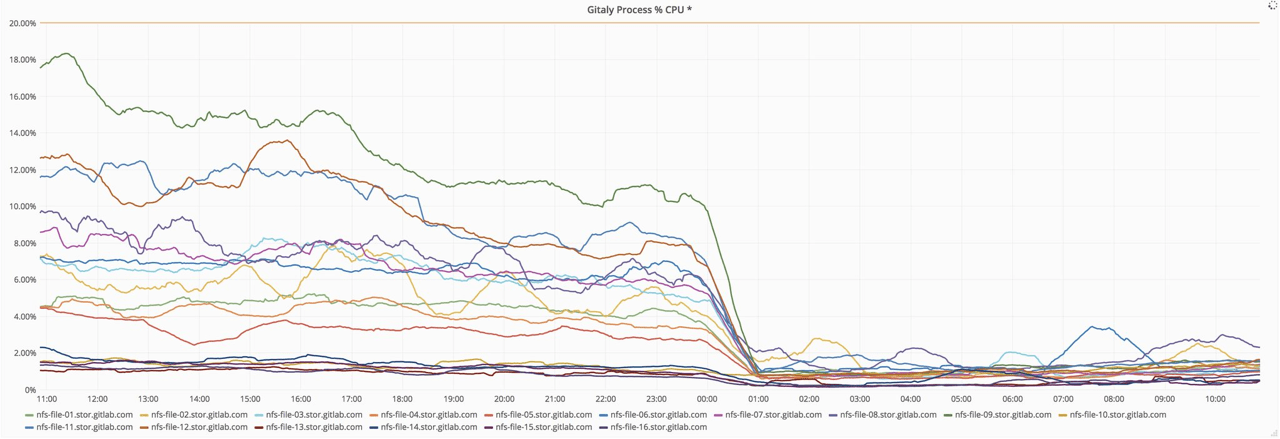
CPU after recompiling with Go 1.9
Here's the 99th percentile latency figures. This chart is using a logarithmic scale, so we're talking about two orders of
magnitude faster!
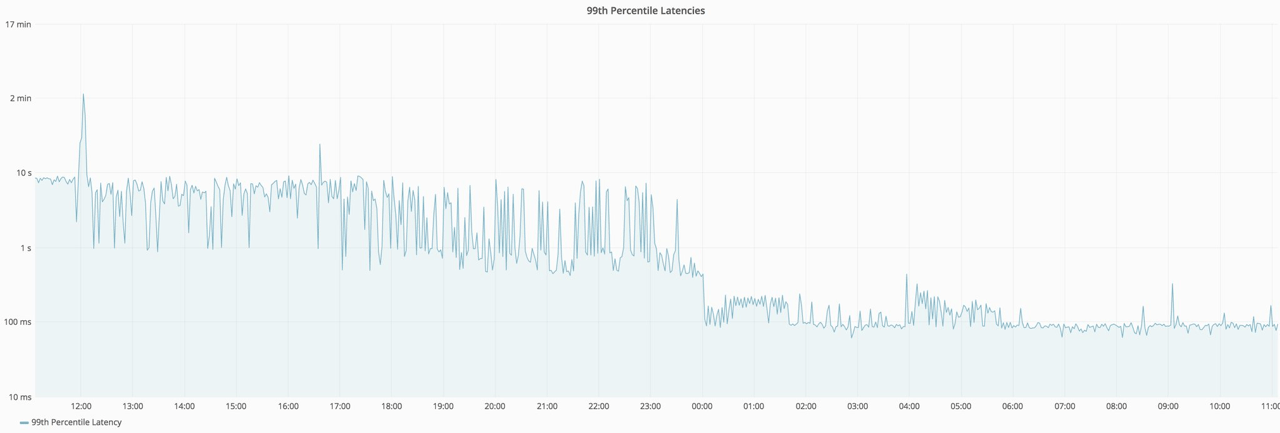
Endpoint latency after recompiling with Go 1.9 (log scale)
Conclusion
Recompiling with Go 1.9 solved the problem, thanks to the switch to posix_spawn. We learned several other lessons
in the process too:
- Having solid application monitoring in place allowed us to detect this issue, and start investigating it, far
earlier than we otherwise would have been able to. - pprof can be really helpful, but may not help when a process
has locked up and won't accept new connections. pprof is lightweight enough that you should consider adding it to your application before you need it. - When all else fails,
SIGABRT thread dumpsmight help. cAdvisoris great for monitoring cgroups. Systemd services each run in
their own cgroup, socAdvisoris an easy way of monitoring a service and all its child processes, together.


